Data Scientist Resume Sample: Experiments and Model Impact
by Larbi SahliPublished
A complete data scientist resume sample with experiment bullets that carry sample size and lift, model bullets that pair AUC with business results, and a posting check.
Users have landed jobs at
- 1Password
- OpenAI
- Notion
- justworks
On this page
Most data scientist resumes list tools. The ones that get interviews list decisions: the experiment that killed a feature before it shipped, the churn model that changed who the retention team called, the forecast that cut over-ordering. A hiring manager reading your resume is asking one question over and over: did this person's work change what the business did?
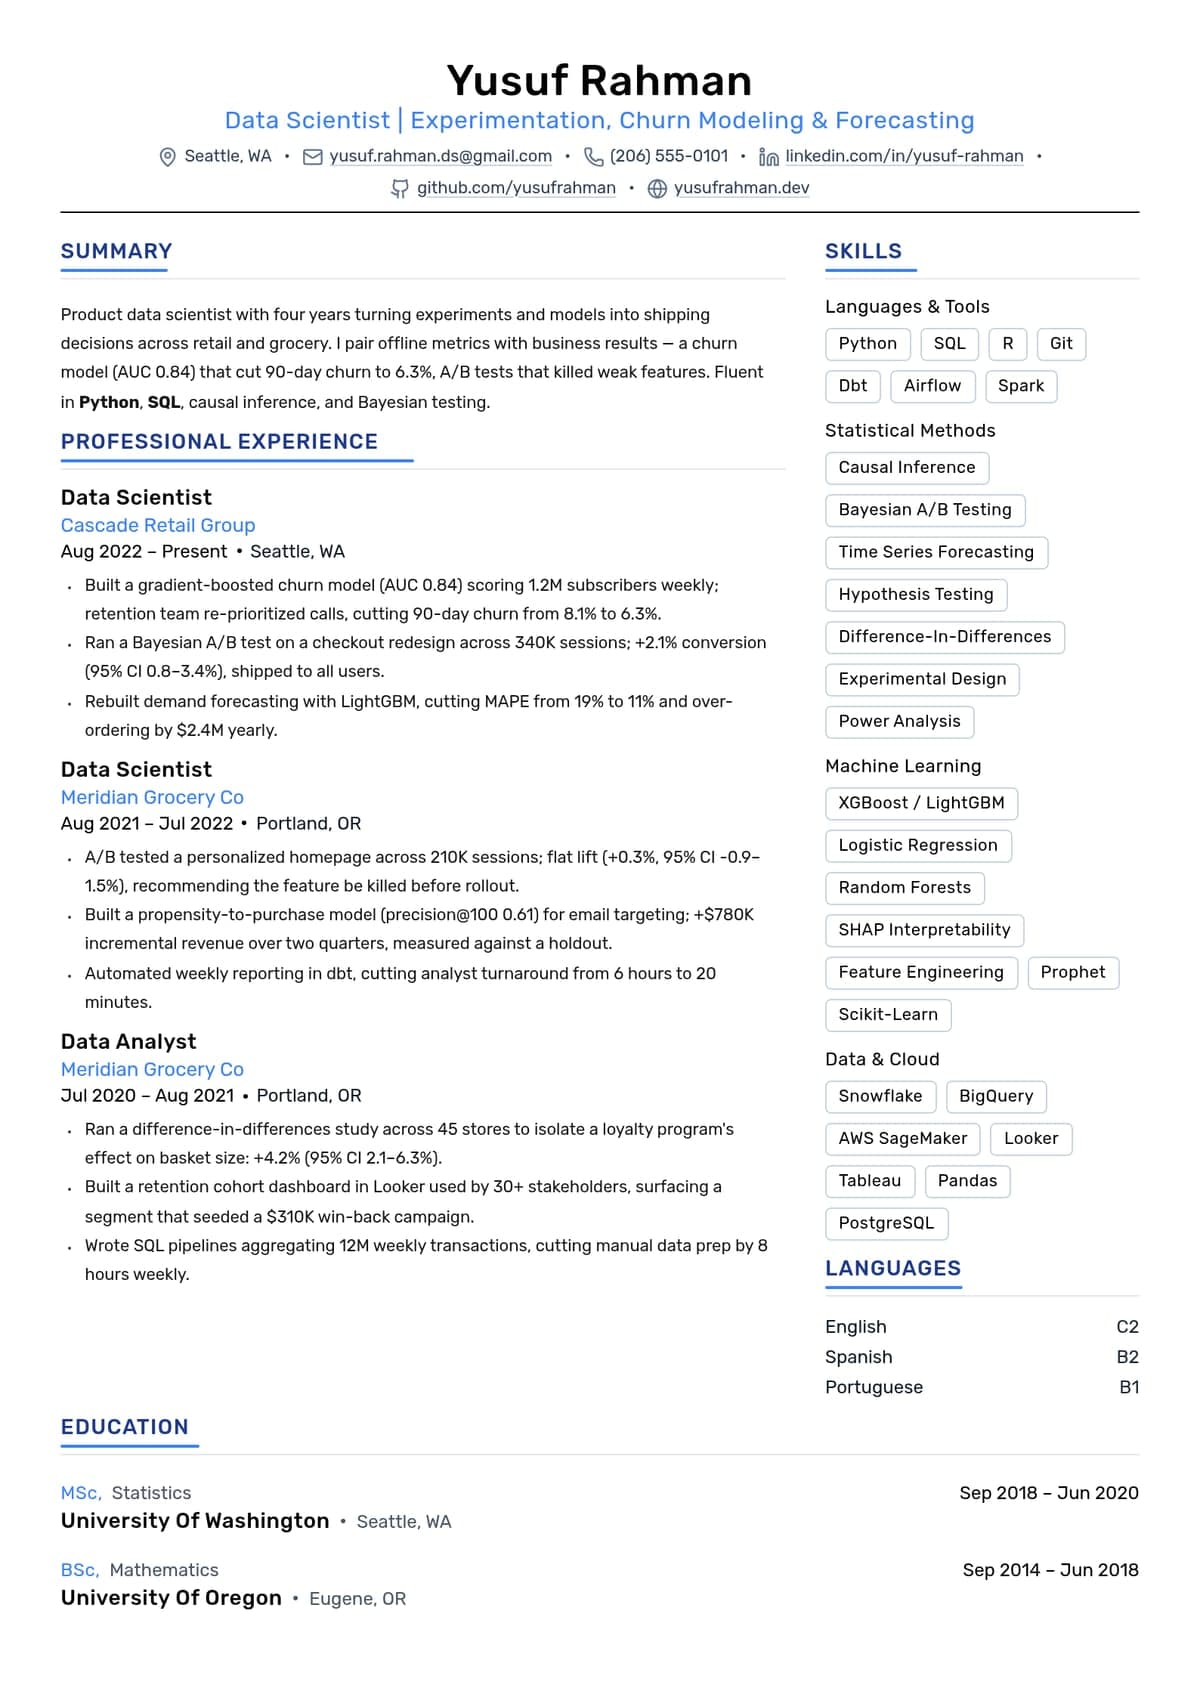
The sample below answers that question in every bullet. It belongs to a product data scientist with four years of experimentation and modeling work, and it follows two rules this article will keep coming back to. Every experiment bullet carries the test's scale, the lift, and the decision it drove. Every model bullet pairs the offline metric with what happened after launch. You can read it, then edit it into your own resume without leaving the page.
A complete data scientist resume sample
This is a mid-level product data scientist: four years in, no management title, working across A/B testing and production models. Watch how the bullets are built. None of them stops at "built a model" or "ran experiments." Each one names the method, the scale, the metric that moved, and the decision or business result on the other end. That structure is the whole argument of this page, and the sections after the sample take it apart line by line so you can rebuild it with your own work.
Data scientist, data analyst, or ML engineer: which resume are you actually writing?
These three titles overlap enough that people apply across all of them with one resume, and it costs them. Each posting screens for a different kind of proof, and a resume optimized for one reads as junior for another. Before you copy the sample above, check which screen you are facing.
| Role | What the posting screens for | The proof your bullets need |
|---|---|---|
| Data analyst | SQL fluency, dashboards, stakeholder reporting | Analyses that answered a business question and the decision that followed |
| Data scientist | Experimentation, statistical inference, models that shipped | Test design at scale, lift with uncertainty stated, model metrics tied to business outcomes |
| ML engineer | Production systems, deployment, latency, MLOps | Models serving live traffic, pipeline reliability, infrastructure choices and their cost |
The sample on this page sits squarely in the middle column. If your work is mostly dashboards and ad hoc SQL, the data analyst resume example is a better starting point, and pretending otherwise will surface fast in a technical screen. If your strength is pipelines and deployment rather than inference, the data engineer resume example is closer to what those hiring managers want to see.
The honest test: read the posting's requirements and count how many are about statistics and experiments versus how many are about infrastructure. A data scientist posting that mentions A/B testing, causal inference, or "driving product decisions" wants the resume this page shows you how to write.
Experiment bullets: hypothesis, scale, lift, decision
"Ran A/B tests to improve conversion" is the most common experiment bullet on data scientist resumes, and it proves nothing. Anyone who has watched a dashboard during a test can write it. A hiring manager wants evidence you can design a test, size it, read it honestly, and turn it into a call the product team acted on.
A complete experiment bullet has four parts, and the sample above uses this structure throughout:
- The hypothesis or change tested, in plain product language: what you changed and why you thought it would matter.
- The scale: sample size, number of users or sessions, or test length. This is what proves you understand power, not just p-values.
- The lift, with its uncertainty: the metric that moved and by how much, ideally with a confidence interval or at least "statistically significant at" a stated level.
- The decision it drove: shipped, killed, rolled back, or redesigned. This is the part almost everyone omits, and it is the part that matters most.
Compare a weak bullet with a rebuilt one. Weak: "Conducted A/B tests on the checkout flow to improve conversion rates." Rebuilt: "Designed and ran a 3-week A/B test of a one-page checkout across ~400K sessions; measured a 2.1% lift in completed purchases (95% CI: 1.4–2.8%), which led product to ship the redesign to all markets." The second version is longer, and every added word is doing screening work: test length shows you let it run, the CI shows you report uncertainty like a statistician, and the shipping decision shows the business trusted your read.
The confidence interval deserves a word, because people worry it looks pedantic. It doesn't. It looks like you know the difference between a real effect and noise, which is exactly the judgment a senior data scientist interviews for. If you genuinely never computed one, state the significance level you used instead. Never invent an interval you can't reproduce, because a good interviewer will ask how you got it.
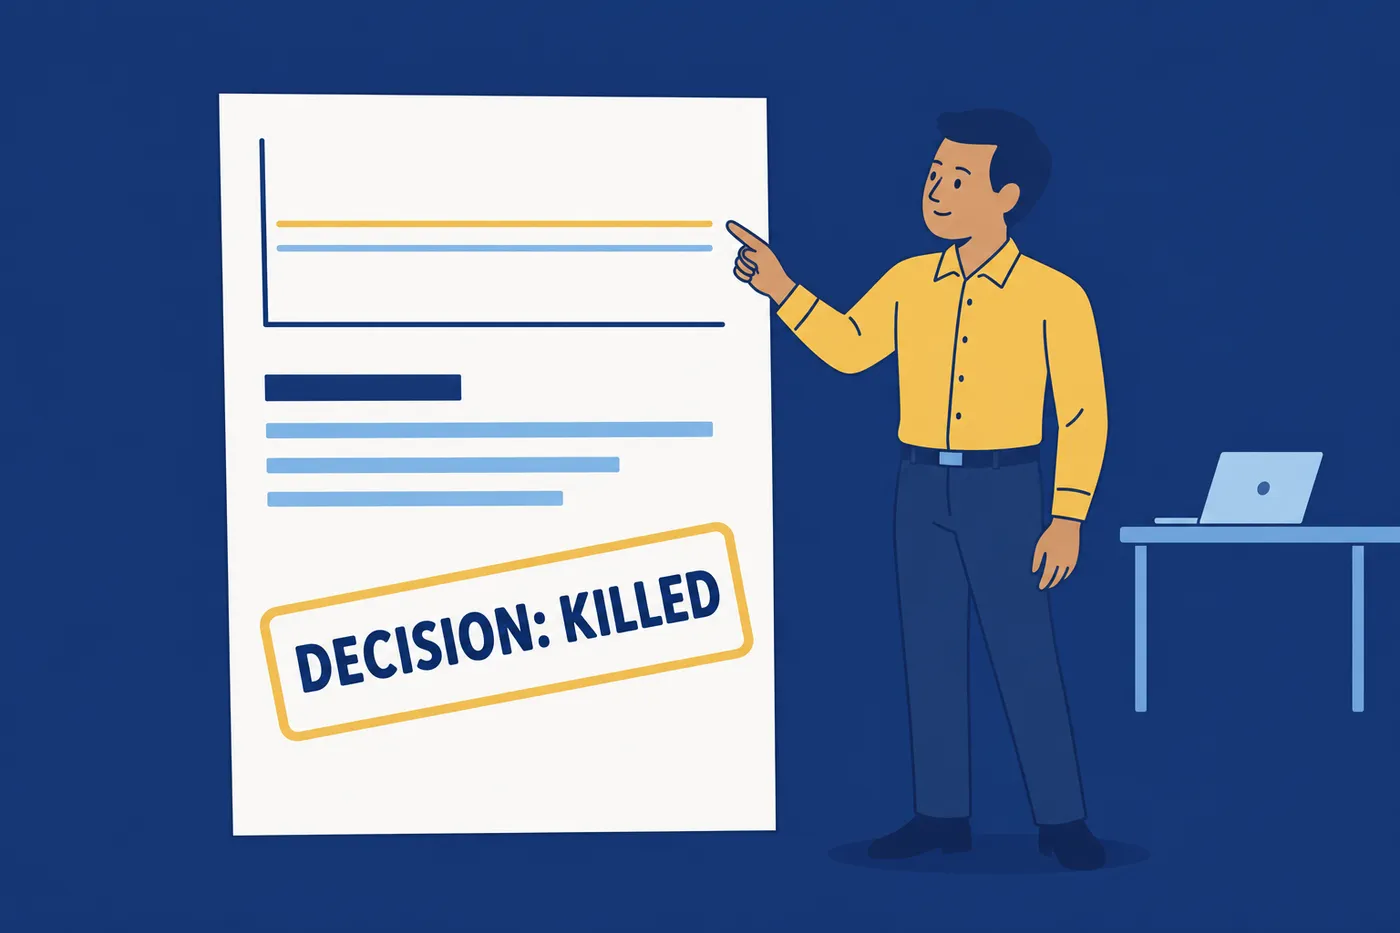
One more habit worth stealing from the sample: include one bullet where the experiment said no. "Tested a recommendation carousel on the home page; no significant effect on engagement after 4 weeks at full power, so we killed the project and redirected the quarter to search ranking" reads as more senior than a fourth positive result. It proves you report what the data says, not what the roadmap wanted.
Model bullets: pair the offline metric with the business result
The offline metric alone is half a bullet. "Built a churn model with 0.86 AUC" tells the reader you trained something that ranks well on a holdout set. It says nothing about whether the model shipped, whether anyone acted on its scores, or whether churn actually fell. Plenty of models with strong AUC die in a notebook, and hiring managers know it.
The pattern that works is metric plus mechanism plus result. Name the model type, give the offline metric that matches the problem, say how the output was used, and end with what changed after launch:
- Churn or retention: "Built a gradient-boosted churn model (AUC 0.84) scoring all active subscribers weekly; retention team targeted the top decile, cutting monthly churn in that segment by 12%."
- Fraud or abuse: "Shipped a fraud-scoring model (precision 0.91 at the review threshold) feeding the manual review queue; caught fraudulent orders earlier and cut chargeback losses by roughly a third."
- Forecasting: "Replaced a heuristic demand forecast with a seasonal time series model, cutting MAPE from 18% to 11% and reducing over-ordering on perishable SKUs."
- Ranking or recommendations: "Improved search ranking with a learning-to-rank model (NDCG@10 up 6% offline), confirmed by a 1.8% lift in click-through in the launch A/B test."
Notice the last example closes the loop: the offline gain was verified in an online test. When you have that, use it, because it connects the two halves of the job in one line. Match the metric to the problem, too. AUC for a balanced classifier, precision at k when a human reviews the top of a queue, MAPE for forecasts. Quoting accuracy on a heavily imbalanced fraud problem is a small tell that costs credibility with a technical reader.
If a model never shipped, say what it did anyway: informed a pricing decision, became the benchmark the next team beat, or proved the signal wasn't there. A model with no consequence of any kind should probably lose its bullet to something that had one.
When results are confidential, or the test came back flat
Two problems stop people from writing bullets like the ones above: they can't disclose the numbers, or the numbers were unimpressive. Both have honest fixes.
For confidentiality, relative numbers almost always pass what absolute numbers would violate. "Cut forecast error by a third" discloses nothing about revenue or volume. "Reduced churn in the targeted segment by 12%" reveals no customer counts. Ranges work the same way: "a test across several hundred thousand users" is specific enough to prove scale without naming the exact figure. What you cannot do is drop the numbers entirely, because a data scientist resume with no quantities reads like a contradiction. If even relative figures are off-limits, keep the scale and the decision: "ran the experiment that determined whether the redesign shipped company-wide" still carries weight.
Flat results are a different case, and worth more than people think. A null result that changed a roadmap decision is a legitimate impact bullet: "Tested the hypothesis that faster onboarding would lift week-1 retention; found no effect at full power, saving the team a quarter of planned rework." The value delivered was the avoided cost, so write the bullet around the avoided cost. What you should not do is dress a flat test as a win with a cherry-picked segment or a peeked interim number. Interviewers in this field are trained to smell exactly that, and one wobbly answer about a suspicious lift can sink an otherwise strong loop.
A skills section built from the work, not a keyword dump
The skills section on a data scientist resume has one job: match the recruiter's filter terms, fast, without claiming anything your experience section can't back up. The sample orders it the way screeners read it.
- Languages first: Python and SQL lead, because nearly every data scientist posting filters on both. Add R or Scala only if you have used them for real work.
- Statistical methods, named precisely: "causal inference," "Bayesian A/B testing," "time series forecasting," "regression modeling." Vague entries like "statistics" or "machine learning" match nothing a recruiter searches and prove nothing to a hiring manager.
- Libraries and frameworks: pandas, scikit-learn, XGBoost, PyTorch or TensorFlow if you genuinely trained deep models, statsmodels for the inference work.
- Platform and tooling last: dbt, Airflow, Spark, a cloud platform, an experimentation platform if you used a named one.
Two hard rules. First, no proficiency bars or star ratings. They are unverifiable, an applicant tracking system (ATS) can't read them, and "Python: 4/5" invites a debate you can't win. Second, every method you list should trace to a bullet. If "causal inference" sits in your skills section, some line in your experience should show a difference-in-differences, an instrumental variable, or an uplift model in action. Skills that appear nowhere in the work are the first thing a technical interviewer probes, and the fastest way to lose the room. For the broader logic of what belongs in this section, the guide to the resume skills section covers it in depth.
Coming from a PhD or research role
A research background is an asset for data science hiring, but only after translation. The failure mode is a resume that reads like a CV: thesis title in full, methods described in field jargon, a publication list eating half of page one. Industry readers spend seconds on each entry and will not decode "investigated hierarchical Bayesian models of perceptual decision-making" into "can do inference on messy behavioral data."
Compress the thesis into one or two lines of impact, written in the same shape as an industry bullet: the method, the scale of the data, and what the result enabled. "Built Bayesian hierarchical models on longitudinal data from 40K participants; findings changed the sampling design of the lab's flagship study" is a thesis, translated. If you taught, supervised, or ran the lab's compute, those are collaboration and infrastructure bullets, and worth one line each.
Publications go in a short section near the bottom, capped at your three or four most relevant, with a line like "6 additional publications available on request" if the list is long. A first-author paper at a venue the hiring team would recognize (NeurIPS, KDD, a top journal in your field) earns its line. The rest is depth the interview can surface. If the career shift is bigger than a title change, the career change resume guide walks through reframing a whole history for a new field.
Kaggle, portfolio notebooks, and GitHub: what earns a line
The rule is simple: side work earns space in inverse proportion to your industry experience. At zero to two years, a strong project section can carry the resume. At four-plus years, like the candidate in the sample, one line is the ceiling, and often the right number is zero.
A Kaggle result earns a line when it's a ranking, not a participation record. A medal or a top-percentile finish in a named competition says you can squeeze performance out of a real dataset under competitive pressure. "Kaggle: 47 notebooks published" says you have free evenings. The same logic applies to portfolio projects: one project with a deployed endpoint, a written analysis, or real users beats five half-finished notebooks. Cut anything that is a tutorial with the dataset swapped, because hiring managers have seen every Titanic and house-prices variant that exists.
A GitHub link belongs in your header only if the profile helps you. Pinned repos with READMEs that explain the problem, clean commit history, actual code you wrote. A profile of forks and abandoned experiments is a link against your interest. The guide on where to put a GitHub link on a resume covers when to include it and how to prepare the profile before you do.

Template choice: one column, and section order by experience
Skip the two-column data scientist resume templates with sidebars and skill charts. A single-column, reverse chronological layout parses cleanly in every ATS, and it reads faster for the human too. In a field where your bullets carry numbers and method names, decoration adds nothing and parsing risk subtracts plenty. The ATS-friendly formatting guide covers the mechanics if you want the full checklist.
Section order should follow your strongest evidence:
- 0–2 years: summary, skills, projects, experience, education. Projects sit high because they are your proof; education stays prominent, especially with a relevant master's or strong quantitative degree.
- 3–5 years (the sample's range): summary, experience, skills, education, with projects cut to one line or removed. Your shipped work is the argument now.
- 5+ years: experience first, immediately after a two-line summary. Education drops to a single line per degree, and coursework disappears entirely.
Does a summary help? At mid-level and above, yes, if it makes a claim the bullets then prove: "Product data scientist with 4 years running experiments and shipping models that changed pricing, retention, and checkout decisions at two marketplaces." That is a thesis statement, and the resume is its evidence. What kills summaries is adjectives: "passionate, detail-oriented data professional" is a line every reader skips and some hold against you. If yours could sit on anyone's resume, cut it and let experience open the page. There are worked versions for this exact situation in the resume summary examples collection.
One page or two? At four years, one page is achievable and usually right. Cross five to six years, or carry a publication section, and a tight second page beats a cramped first one.
Check the finished resume against the posting, then export as PDF
Data scientist postings vary more than their identical titles suggest. One is really an experimentation role, another wants forecasting, a third says "data scientist" and means ML engineering. The last step before applying is reading the posting's specific asks against your resume and checking each one is proven, not just mentioned. If the posting says A/B testing, is there a bullet with a designed test and a decision? If it says causal inference, does a named method appear in your work? A skill listed in your skills section with no supporting bullet counts as a gap, because that's how a hiring manager scores it.
You can run that check by hand with two windows open, and the guide to checking a resume against a job description shows the manual method. Roleframe automates the tedious half: paste the posting into a duplicate of your base resume and the fit report reads it like a screener would, scores the resume against it, and flags which of the posting's asks (A/B testing, causal inference, forecasting, production models) your resume never proves. Then you close the gaps yourself, with Remi suggesting rewrites bullet by bullet and you approving each change. Nothing goes on the page you didn't sign off on, which matters in a field where every claim gets probed in a technical interview.
Export and submit as PDF. It preserves your layout on every machine that opens it, and modern ATS software parses a text-based PDF cleanly. Use another format only if a specific employer explicitly demands it, and default back to PDF everywhere else. If the application asks for a cover letter, the data scientist cover letter examples pair with this sample.
Frequently asked questions
- How long should a data scientist resume be?
One page up to roughly five years of experience, which covers the candidate in this sample. Past that, or if you carry publications from a research background, a focused two pages beats a cramped one. The test is density: if every bullet carries a method, a number, and a consequence, length takes care of itself. Padding to fill a second page is worse than white space.
- Should I put projects on my resume if I already have work experience?
At two or more years of industry experience, shipped work outranks side projects, so cut the project section to one strong line or remove it. The exception is a project that proves something your job can't: a deployed model in a domain you're moving toward, or a competitive result like a Kaggle medal. One finished, documented project always beats several half-built notebooks.
- What if I can't share my company's numbers on my resume?
Use relative figures and ranges, which prove impact without disclosing anything sensitive. "Cut forecast error by a third" and "a test across several hundred thousand sessions" reveal no revenue, volume, or customer counts. Dropping numbers entirely is the one move to avoid, because a data scientist resume without quantities undermines its own premise.
- Do data scientist resumes need to pass an ATS?
Yes, in the sense that the applicant tracking system must parse your resume into clean fields and recruiters filter on keywords like Python, SQL, and A/B testing. A single-column layout with standard section headings handles the parsing. The keywords should come from the posting itself: mirror the exact terms it uses, in bullets that prove them, and skip the myth that you need hidden text or exact-match stuffing.
- Is a master's or PhD required to get data scientist interviews?
Many postings list an advanced degree as preferred rather than required, and demonstrated experimentation and modeling work regularly beats credentials at the resume screen. If you have the degree, give it one or two lines and spend the space on impact. If you don't, lead with shipped work and let the bullets make the statistical case a transcript would have.
- Should I include a summary on a data scientist resume?
At mid-level and above, yes, if it makes a specific claim the resume then proves: years of experience, the kind of work (experimentation, forecasting, production models), and the decisions it changed. Skip it if all you can write is adjectives. A generic "passionate data professional" line costs more than it earns, and early-career candidates are usually better served by leading with skills and projects.
- How is a data scientist resume different from a data analyst resume?
The screen looks for different proof. Analyst postings filter on SQL, dashboards, and stakeholder reporting, and the winning bullets show analyses that drove decisions. Data scientist postings filter on experimentation, statistical inference, and models in production, and the winning bullets show designed tests with stated uncertainty and models tied to business results. Applying to both with one resume usually means losing both screens, so keep a version per target role.
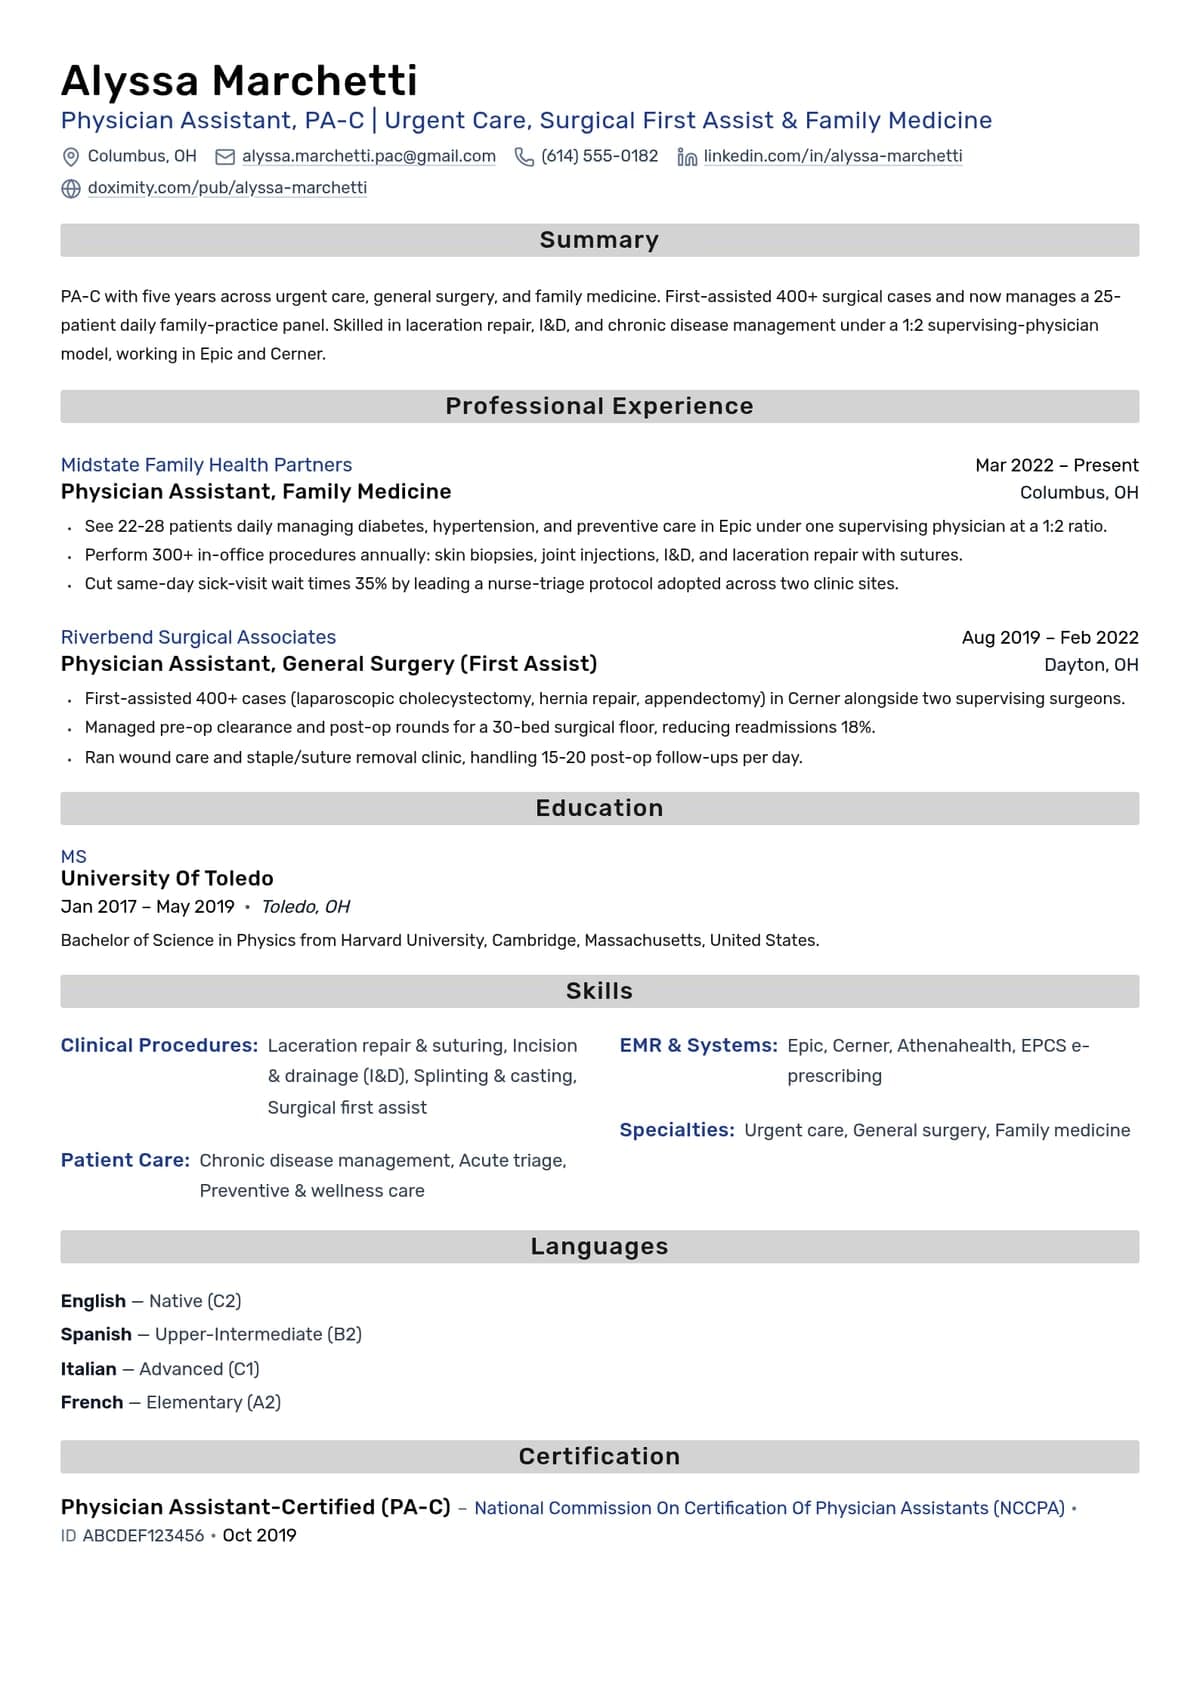

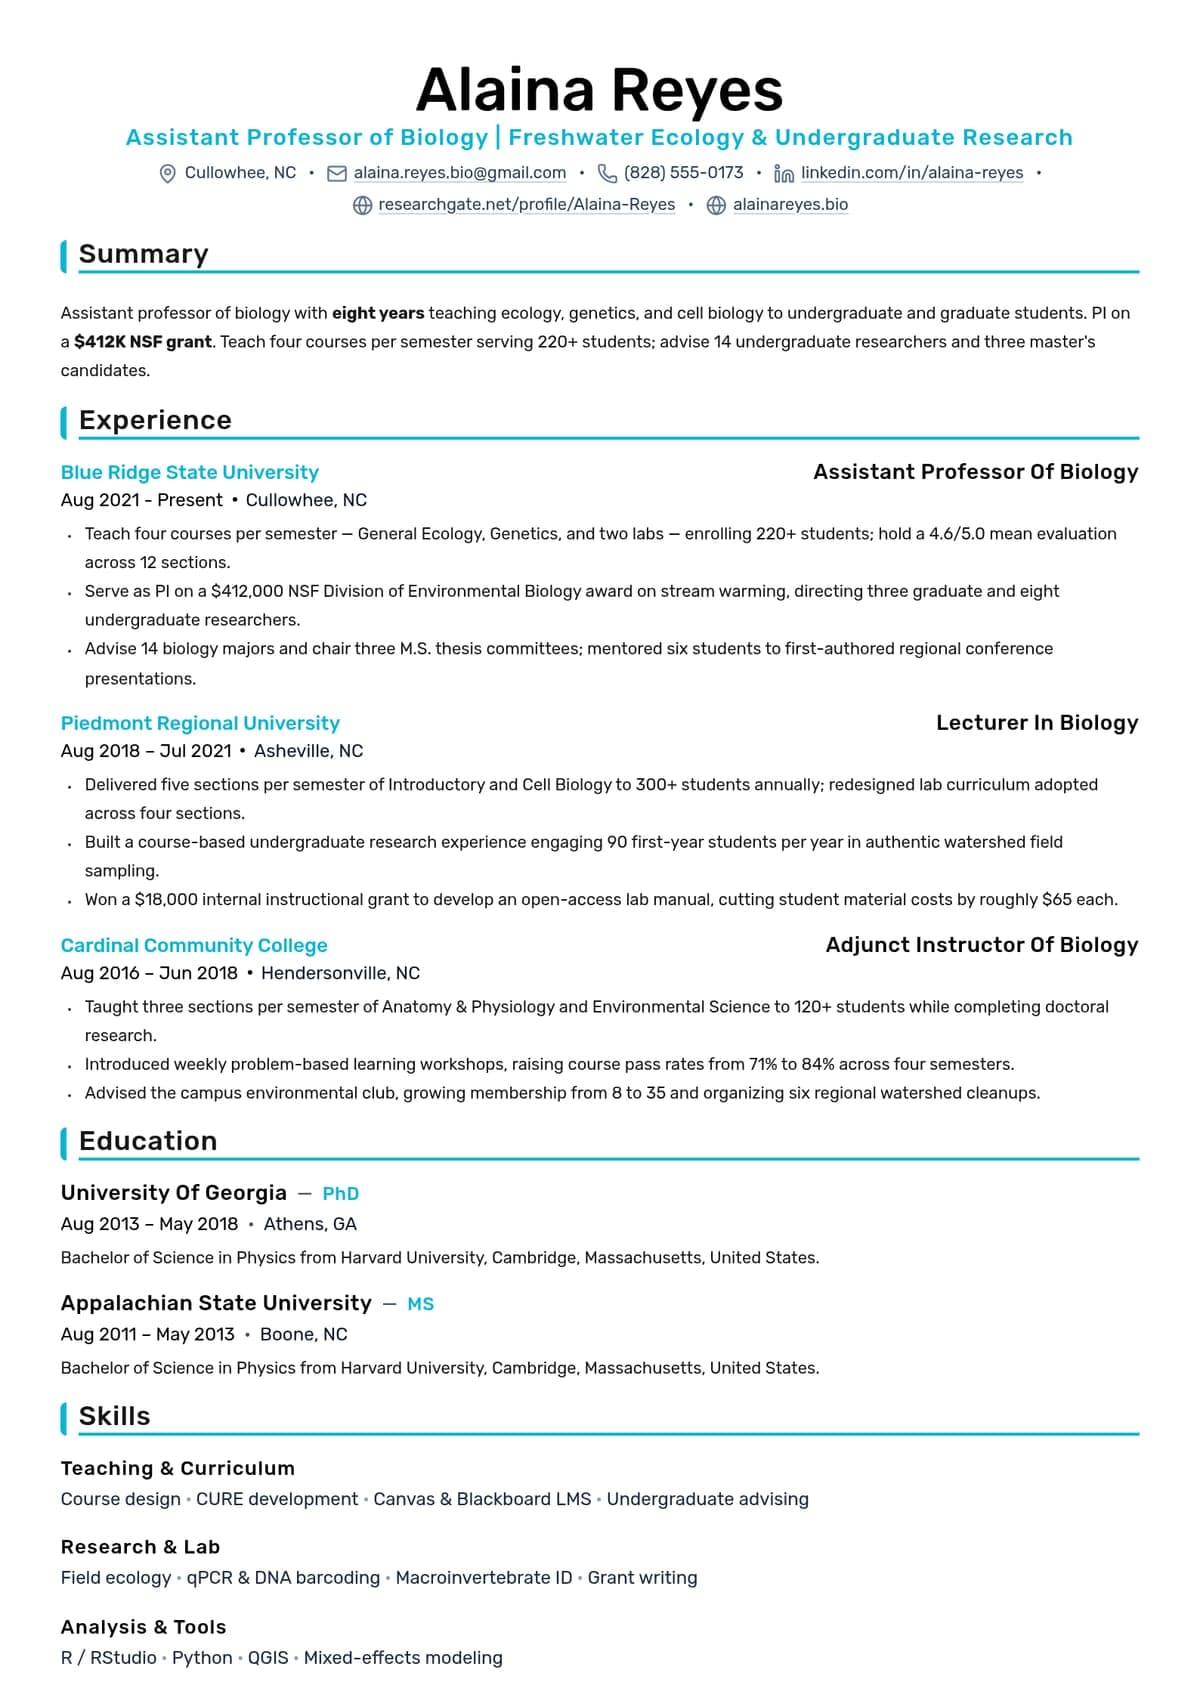
Build yours on the same template.
Every example here is built on a template you can open in the editor. Start from the same layout and write your own experience into it, then download the PDF free, with no watermark.


