Data Analyst Resume Examples (And the Skills Employers Actually Filter For)
by Larbi SahliLast Updated
A full data analyst resume example, the skills recruiters actually filter for (SQL, Python, Tableau), and how to quantify your impact bullet by bullet.
Users have landed jobs at
- 1Password
- OpenAI
- Notion
- justworks
On this page
A data analyst resume gets screened twice before anyone debates your merits. First an applicant tracking system (ATS) checks whether the words in the posting appear in your document. Then a recruiter, who is usually not technical, skims it for seconds looking for the same words plus evidence you did something with them.
Most data analyst resumes fail one of those two screens. They either describe tools without outcomes ("proficient in SQL, Python, Tableau") or outcomes without tools ("improved reporting efficiency"), and the strongest candidates in the pipeline do both in the same bullet. This page shows you a complete example that survives both screens, how to adapt it if you are changing careers into analytics, and which skills postings actually ask for, so you stop guessing what belongs in your skills section.
What makes a great data analyst resume
The job of a data analyst is to turn data into decisions. The job of a data analyst resume is to prove you have done that, with named tools and measurable results. Everything else is formatting.
Concretely, the resumes that get interviews share four traits:
- Every bullet pairs a tool with a decision. Not "analyzed customer data" but "built a SQL churn cohort analysis that shifted retention spend toward month-two customers, cutting churn in that segment." The tool proves you can do the work; the decision proves the work mattered.
- The skills section mirrors the posting. ATS keyword matching is often literal. If the posting says "Power BI" and your resume says "Microsoft business intelligence tools," you may not match. Use the exact names of the tools you know.
- Numbers appear early and often. You work with data for a living. A resume with no numbers on it is a self-contradiction, and recruiters notice.
- The layout parses cleanly. A single-column body, standard section headings (Experience, Skills, Projects, Education), and a PDF export. Tables, text boxes, and graphical skill bars are where ATS parsers go to die.
One more thing hiring managers say consistently: projects count. A public dashboard, a documented analysis on GitHub, or a Kaggle notebook can carry a thin experience section, and even experienced analysts benefit from one project that shows initiative beyond their day job.
Data analyst resume example: mid-level professional
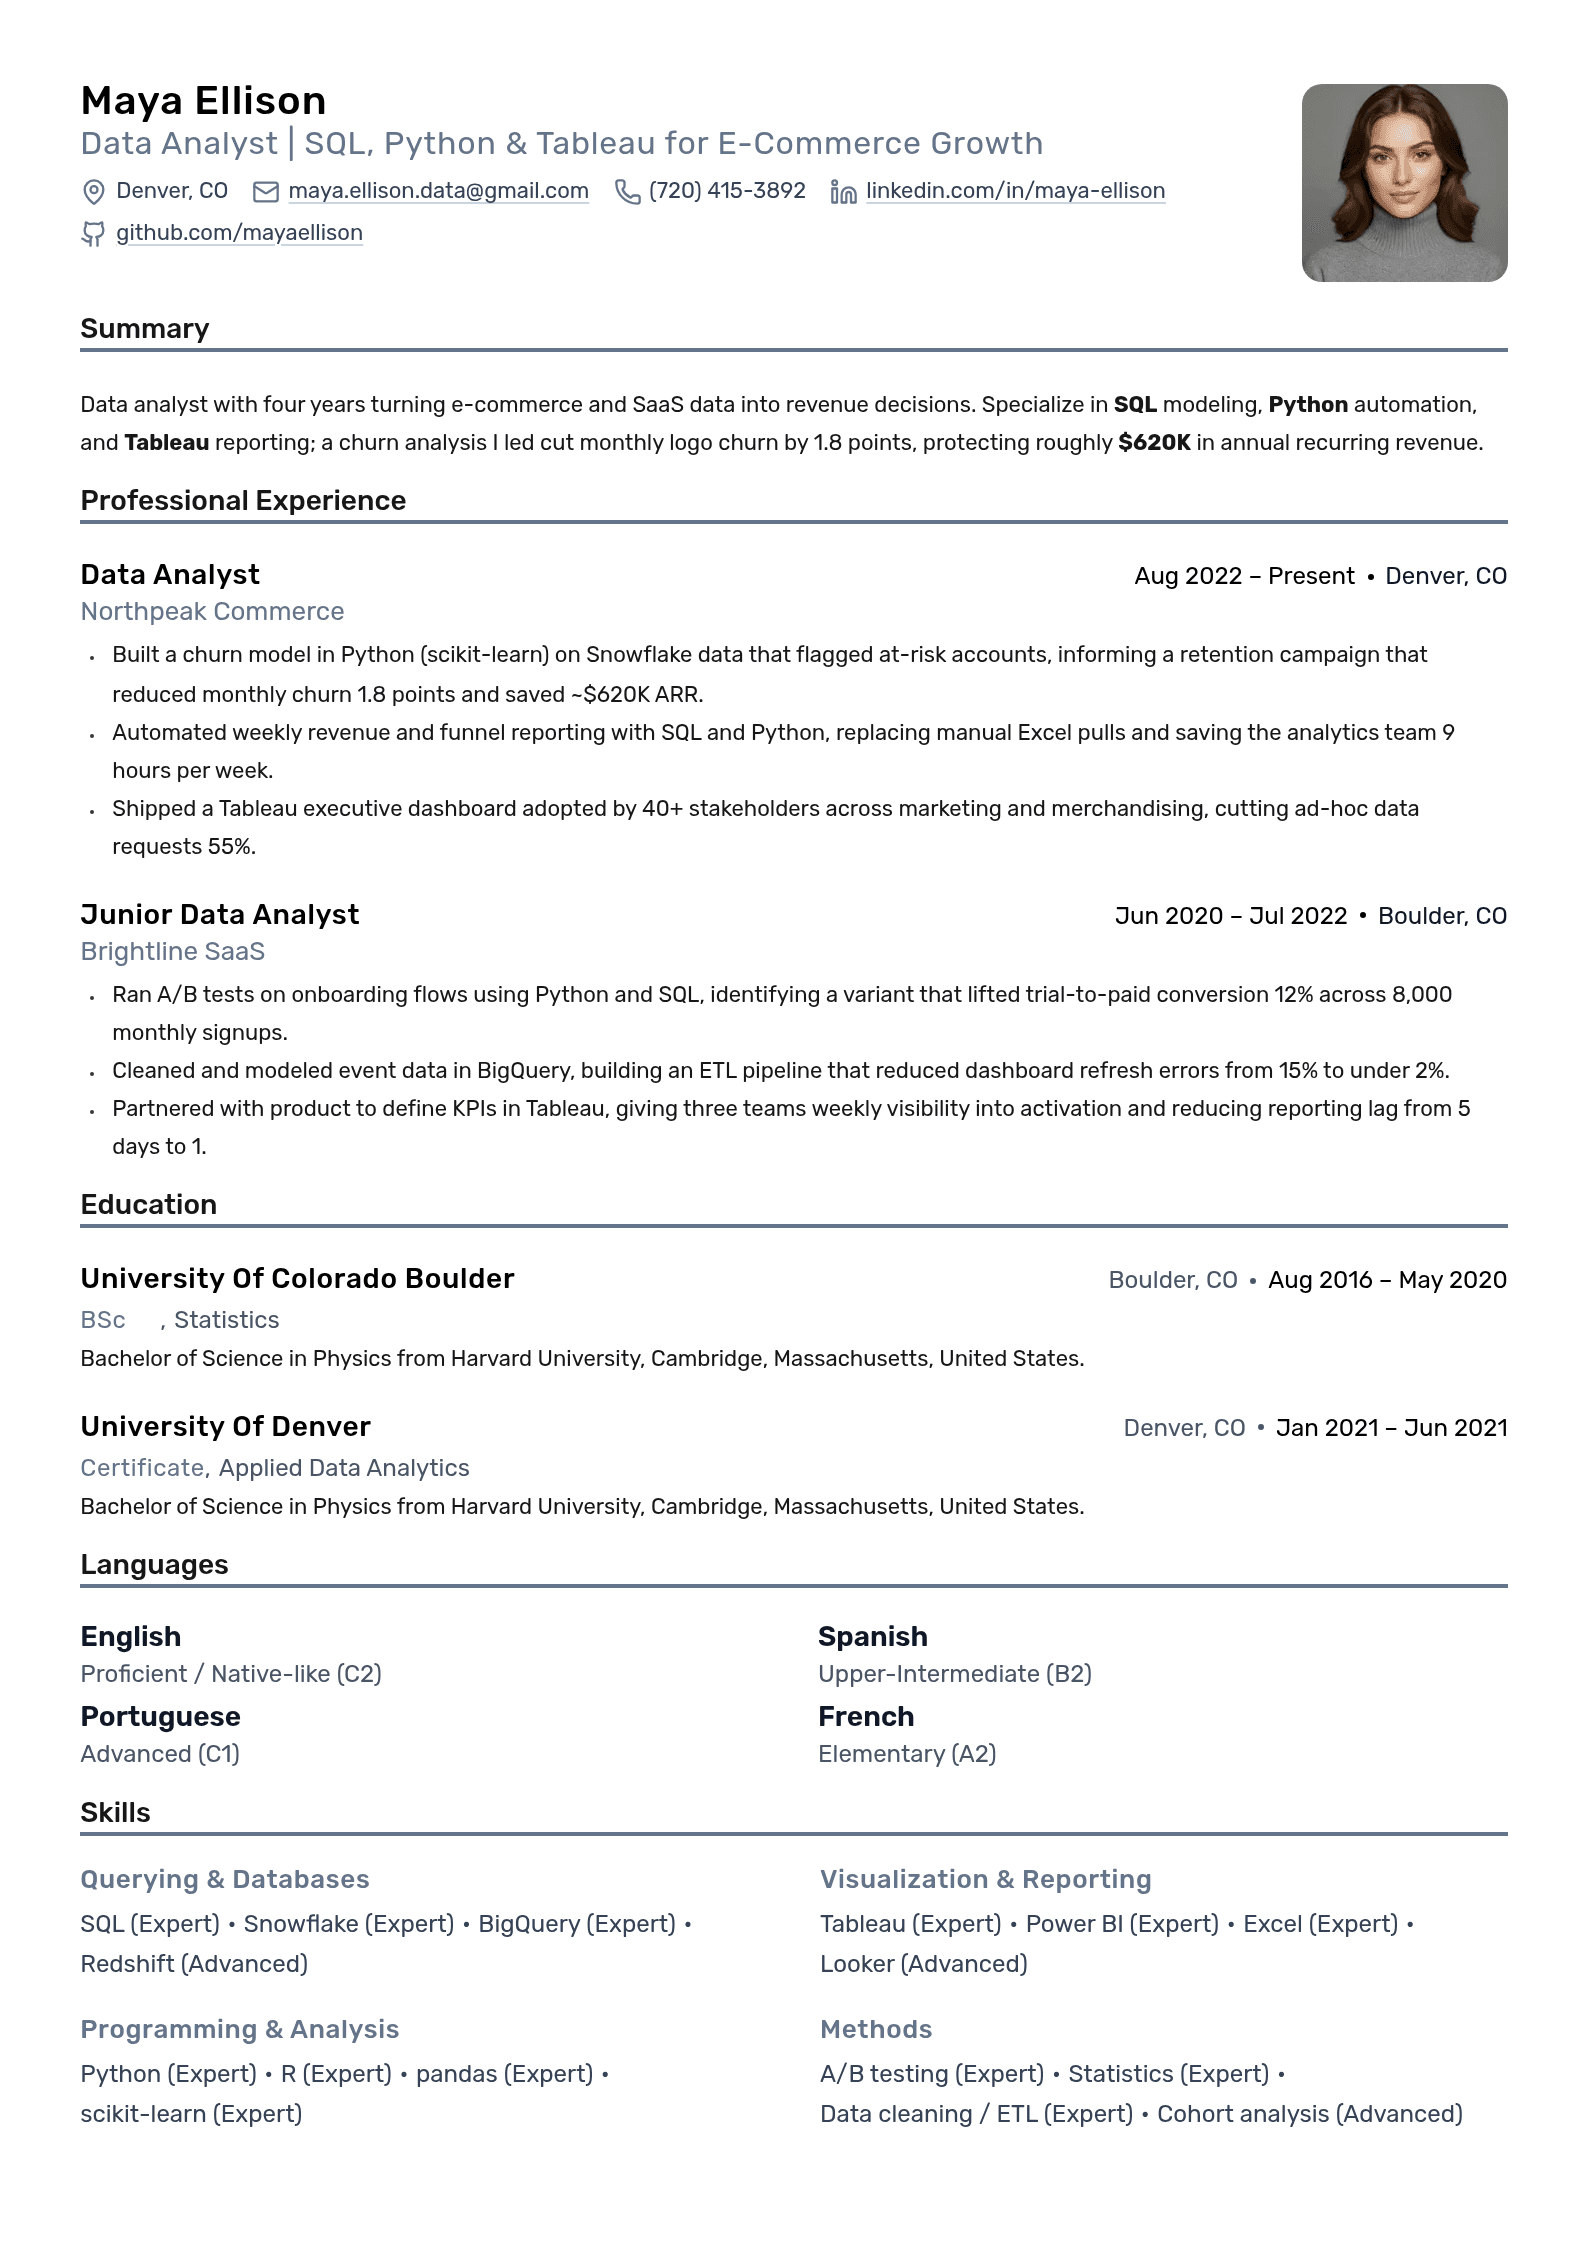
Here is a complete data analyst resume example for a professional with a few years of experience. Read the bullets closely: each one names a tool, an action, and a result, and the summary makes a specific claim instead of describing a personality. This is the structure to copy, even if your domain is different.
Maya Ellison
Data Analyst | SQL, Python & Tableau for E-Commerce Growth

Summary
Data analyst with four years turning e-commerce and SaaS data into revenue decisions. Specialize in SQL modeling, Python automation, and Tableau reporting; a churn analysis I led cut monthly logo churn by 1.8 points, protecting roughly $620K in annual recurring revenue.
Professional Experience
Data Analyst
Built a churn model in Python (scikit-learn) on Snowflake data that flagged at-risk accounts, informing a retention campaign that reduced monthly churn 1.8 points and saved ~$620K ARR.
Automated weekly revenue and funnel reporting with SQL and Python, replacing manual Excel pulls and saving the analytics team 9 hours per week.
Shipped a Tableau executive dashboard adopted by 40+ stakeholders across marketing and merchandising, cutting ad-hoc data requests 55%.
Junior Data Analyst
Ran A/B tests on onboarding flows using Python and SQL, identifying a variant that lifted trial-to-paid conversion 12% across 8,000 monthly signups.
Cleaned and modeled event data in BigQuery, building an ETL pipeline that reduced dashboard refresh errors from 15% to under 2%.
Partnered with product to define KPIs in Tableau, giving three teams weekly visibility into activation and reducing reporting lag from 5 days to 1.
Education
University of Colorado Boulder
BSc
Bachelor of Science in Physics from Harvard University, Cambridge, Massachusetts, United States.
University of Denver
Certificate
Bachelor of Science in Physics from Harvard University, Cambridge, Massachusetts, United States.
Languages
Skills
Querying & Databases
Programming & Analysis
Visualization & Reporting
Methods
Projects
Retail Basket Analyzer
Built a Python market-basket model on 120K public transactions, surfacing product pairings that would lift average order value an estimated 7%.
Public Transit Delay Dashboard
Analyzed 2M transit records in SQL and visualized delay patterns in Tableau, identifying three routes accounting for 34% of citywide delays.
Certificates
Tableau Desktop Specialist
Validated foundational knowledge of AWS cloud concepts, security, and billing.
Covered core services including EC2, S3, RDS, Lambda, and CloudFront.
Demonstrated understanding of shared responsibility model and basic architectural best practices.
Awards
Analytics Impact Award
Recognized for building a cloud-native AI productivity tool.
Why this example works, section by section
The summary earns its space. Three lines: what kind of analyst, in what domain, with what proof. A summary that could describe any analyst ("detail-oriented professional with a passion for data") is worse than no summary, because it spends the most valuable real estate on the page saying nothing.
Experience bullets follow tool, action, result. Notice that no bullet in the example starts with "Responsible for." Responsibilities describe the job; results describe you. Three to five bullets per role is the right density for a mid-level analyst, with the strongest result first in each role.
The skills section is grouped, not dumped. Languages and querying, BI and visualization, and statistics or methods, each on its own line. A recruiter scans it in two seconds; the ATS reads every keyword. A twenty-item comma soup does neither job well.
Projects appear even with real experience. One project with a measurable outcome signals that you analyze data because you find it interesting, which is exactly what hiring managers for analyst roles say they want to see. If you are earlier in your career, this section grows and moves up; the entry-level data analyst resume example shows that version.
Data analyst resume example: career changer
A career changer's resume uses the same components in a different order. If your titles say "marketing coordinator" or "operations manager" but you are applying for analyst roles, the standard reverse-chronological layout works against you: the recruiter reads the wrong title first and stops.
Change three things:
- Lead with skills and projects, not experience. Put a categorized skills section directly under your summary, then a projects section with two or three substantial analyses, then experience. The reader should see SQL and a dashboard before they see your old title. Section order is an argument, and yours needs to argue "analyst" from the first inch of the page. The right resume section order for your experience level covers this in depth.
- Reframe the old job as data work, honestly. Almost every job produces data decisions. The operations manager who built the Excel model that changed staffing levels did analyst work; write that bullet with the tool and the outcome, and drop the bullets about duties that do not transfer. Do not inflate a pivot table into "machine learning," because the interview will find you out.
- Use a targeted summary that names the transition. One or two lines that say where you came from, what analytical skills you built there, and what you have added since (a certificate, a bootcamp, a portfolio). If you are early in the switch with little to summarize, a sharp objective can work instead; here is how to write a resume objective for a career change.
Career changers also lean harder on projects, and the bar is specific: a project counts when it starts from a messy real dataset, makes a defensible decision or recommendation, and is visible somewhere a recruiter can click. A tutorial you followed does not count. For the full playbook, see how to write a career change resume that gets interviews.
The most requested data analyst skills
Roleframe's job-analysis engine reads real data analyst postings the way a recruiter's filter does, keyword by keyword, and the pattern across them is consistent enough to plan around. A small core of skills shows up almost everywhere, a second tier separates candidates, and a long tail depends entirely on the company's stack. Run any specific posting through a keyword match against your resume before you apply, because the tail varies, but the core does not.

| Skill | How often postings ask for it | What to do about it |
|---|---|---|
| SQL | The single most requested hard skill; treat it as mandatory at every level | Name it in your skills section and show it in at least two bullets doing real work (joins, window functions, cohort queries) |
| Excel | Still requested across the majority of analyst roles, especially outside tech | List it, and mention advanced use (pivot tables, lookups, modeling) rather than the bare word |
| A BI tool (Tableau or Power BI) | Nearly every posting names at least one, and usually a specific one | Match the exact tool the posting names; list the other only if you genuinely know it |
| Python | Common and growing; a differentiator at mid-level, expected at senior levels in tech | List it with the libraries you use (pandas, NumPy, matplotlib) and one bullet showing automation or analysis |
| Statistics / A-B testing | Frequently requested, especially in product and marketing analytics | Name the methods (hypothesis testing, regression, experiment design), not just the word "statistics" |
| Data cleaning / ETL | Requested often, phrased many ways (data wrangling, data preparation, pipelines) | Show it inside a bullet about a real dataset rather than as a standalone skill |
| Cloud warehouses (Snowflake, BigQuery, Redshift) | Stack-dependent; concentrated in tech and larger data teams | Add only the ones you have used; mirror the posting's naming exactly |
| R | A minority of postings, concentrated in research, healthcare, and biostatistics | List it if you have it; do not learn it for general analyst roles before Python |
SQL vs. Python vs. Tableau: what employers actually filter for
These three generate the most anxiety, so here is the practical ranking.
SQL is the filter, not the differentiator. It appears in more analyst postings than any other skill, which means recruiter keyword filters treat it as a pass/fail gate. Missing it from your resume is disqualifying; having it earns you nothing extra. The differentiation comes from what your bullets show you did with it. "Wrote SQL queries" is table stakes; "designed the SQL cohort model behind the retention dashboard leadership reviews weekly" is a candidate.
Python is the tiebreaker. A meaningful share of postings request it, and among mid-level candidates it often decides who gets the interview when two resumes show similar SQL and BI experience. If you have it, show it automating something: a report that used to be manual, a data-quality check, a scraper feeding an analysis. If you do not have it yet, do not list it, because Python questions come up in nearly every analyst interview loop and a hollow keyword costs more than a missing one.
Tableau vs. Power BI is an organization question, not a skill question. Postings almost always name the specific tool the company already pays for, and ATS matching against that name is literal. The tools are similar enough that experience in one transfers in weeks, but your resume should still lead with the one the posting names. If you know Tableau and the posting says Power BI, list both if you can defend both, and say "BI tools: Tableau (advanced), Power BI (working)" rather than pretending parity.
Where each one lives on the page. All three belong in the skills section by exact name. SQL and your BI tool should also each appear in at least two experience bullets attached to outcomes. Python needs at least one. A skill that exists only in the skills section reads as a keyword; a skill that appears in a bullet reads as experience.
How to quantify your data projects
Analysts have an unfair advantage here: your work produces numbers by definition. If your resume has none, you have not looked hard enough. Four types of numbers are almost always available:
- Time saved. Automation is the easiest win to quantify. "Automated the weekly revenue report with Python and SQL, cutting preparation from six hours to twenty minutes."
- Money or metric moved. The analysis that changed a decision usually moved a number. "Identified checkout drop-off in funnel analysis; the resulting UX fix lifted conversion on mobile." Add the percentage if you can defend it in an interview.
- Scale handled. Data volume, sources joined, systems reconciled. "Consolidated reporting across five data sources into a single Tableau workspace."
- Adoption. A dashboard nobody opens is a hobby. "Built the sales operations dashboard used weekly by 30 account executives" proves your work entered the company's bloodstream.
The rewrite pattern is mechanical. Take a duty bullet, ask "compared to what, and who cared," and rebuild it. "Responsible for monthly KPI reporting" becomes "Rebuilt monthly KPI reporting in Power BI, replacing a 40-tab spreadsheet and cutting the close process by two days." Same job, different resume.
Two honest caveats. If your numbers are confidential, use relative figures ("reduced query runtime by roughly 80%") or scope ("for a team of 12 stakeholders") instead of absolute revenue. And never invent a number to fill the pattern; a fabricated metric is the one resume mistake that follows you into the interview and out of the pipeline.
Structuring your education and certifications
Placement depends on experience. With two or more years as an analyst, education goes at the bottom: degree, institution, year, done. Entry-level candidates and recent graduates put it higher and can include relevant coursework (statistics, econometrics, database systems) as one line. GPA is a judgment call; here is when a GPA helps and when it hurts.
Certifications earn their place when the posting cares. The pattern from real postings: entry-level and career-change roles mention certificates like the Google Data Analytics certificate far more often than mid-level ones, where demonstrated experience replaces them. Tool and platform certifications (Tableau, Power BI, cloud warehouse certs) matter most when the posting names that exact stack. If a certification substitutes for a degree or experience you lack, put it near the top; if it merely confirms skills your bullets already prove, it goes at the bottom. The full decision tree is in where to put certifications on a resume.
Format certifications with issuer and year. "Google Data Analytics Professional Certificate, Coursera, 2025." Expired or abandoned certifications come off the resume; a lapsed cert invites a question you do not want to answer.
Import your existing resume and edit live
Reading an example is the easy part. The work is rewriting your own bullets to the tool-action-result pattern and matching your skills section to each posting, and that is where most people stall, because retyping a resume into a new tool feels like a tax.
You can skip the retyping. Roleframe imports your existing resume as a PDF and turns it back into editable blocks, roles and dates and bullets in the right places, with an analysis already run so the first thing you see is a scored document with its weak sections named. From there, duplicate it for a specific posting and the fit report shows your ATS score against that job, the exact keywords the posting asks for that your resume is missing, and a prioritized plan. Remi, the career copilot in the editor, helps you rewrite bullet by bullet, and you approve every change, so every line stays something you can defend in the interview. Career changers get one more useful thing: sections drag to a new order, so leading with skills instead of experience takes seconds, not a rebuild. The editor itself is free to use with no account, and the PDF export carries no watermark.
Export and submit as PDF. It preserves your formatting exactly, parses cleanly in modern ATS software, and is what the editor produces. Only send anything else if an employer explicitly asks for it.
Frequently asked questions
- What should I include in a data analyst resume?
Six sections: contact information, a specific two-to-three-line summary, experience with quantified tool-action-result bullets, a categorized skills section that mirrors the posting's exact tool names, at least one project with a measurable outcome, and education with relevant certifications. Career changers reorder these to lead with skills and projects. Keep the layout single-column and export as PDF so ATS parsing stays clean.
- What are the top 3 skills for a data analyst?
SQL, a business intelligence tool (Tableau or Power BI, matching whichever the posting names), and the ability to communicate findings to non-technical stakeholders. SQL is the most requested hard skill in analyst postings and functions as a pass/fail filter. Python is a close fourth and often decides between otherwise similar mid-level candidates.
- Can I make $200k as a data analyst?
It happens, but it is not the typical analyst path. Compensation at that level is concentrated in senior and staff-level roles at large tech and finance companies, and many people who reach it have moved from pure analysis into analytics engineering, data science, or management. If that is your target, the resume implication is clear: build the Python, statistics, and business-impact evidence that supports the next title, not just the current one.
- Will AI replace data analysts?
AI is already automating parts of the job, especially writing routine queries and generating first-draft charts. What it does not do well is know which question matters, whether the data can be trusted, and how to get a skeptical stakeholder to act on a finding. The role is shifting toward judgment and communication rather than disappearing, and the practical resume move is to show AI tools in your workflow as an accelerant, alongside outcomes only you could have produced.
- Should a data analyst resume be one page or two?
One page through roughly your first five to seven years, including career changers. Two pages are defensible for senior analysts with multiple substantial roles, but only if page two carries real results rather than overflow. The one page vs. two breakdown by experience level covers the edge cases.
- Should I put my GitHub or portfolio link on a data analyst resume?
Yes, if there is something worth clicking: a documented analysis, a public dashboard, or a clean project repository with a readable README. Put the link in your header next to your email and LinkedIn. A link to an empty or tutorial-only profile hurts more than no link, so curate before you publish.
- How do I write a data analyst resume with no experience?
Lead with skills and projects instead of experience, and make the projects real: messy public data, a defensible recommendation, a visible artifact. Reframe data work from any previous job or coursework as experience bullets with tools and outcomes. The entry-level data analyst resume example shows the full structure, and pairing the resume with a tailored data analyst cover letter helps most exactly at this stage, when the resume alone cannot carry the story.


Ready when you are
Send the tailored resume, not the generic one.
Paste a job posting and Roleframe scores your resume against it, then helps you close the gaps one approved edit at a time, so you apply while the role is still fresh.